Monday 30 December 2013

year-end opportunities in eurusd and Japan

Right now I'm quite short fixed income in the US and Japan - what you'd have called a risk-on position a year ago - and so selling eurusd looks like a good offsetting trade. We're just reaching a nice 5 year trend line, so it's possible to set quite a tight stop on the upside :


The situation in Turkey is a potential catalyst for a selloff in eurusd (you can imagine contagion into the Euro if things get out of control). There seems to be some end-of-year selling of dollars at the moment, and from a medium term perspective the economic strength is definitely clearer in the US than in the eurozone, so this looks like a good entry point for several reasons. Anyway, I'm selling it around here with a stop not too far above that trend line. We'll see if it holds. 

In Japan I'm switching from short yen to long Nikkei / short JGBs. I've just taken profit on some usdjpy as the trade now looks crowded and possibly overbought in the short term. I prefer owning high dividend Nikkei stocks. The trading companies are absurdly cheap (Marubeni, Mitsui and Sumitomo have forward p/es around 6.5 and dividend yields of 3.5%) and the megabanks aren't much more expensive. I'm reminded of the situation in the UK 3 years ago : retail investors bought boring, high dividend, low p/e stocks in their ISAs (tax free wrapper accounts) when they realised rates wouldn't rise for years and high inflation would penalise cash deposits. NISAs are the Japanese equivalent and have just started trading. If I was a Japanese pensioner sitting on a lot of cash and worried by rising inflation I'd want the safest, most boring high income stocks I could think of, preferably names I'd known for years, all held in a tax free account. Buying the trading companies in a NISA fits the bill perfectly. They've been outperforming the index recently, as you'd expect as the NISA deadline approaches. 

JGBs have no obvious reason to sell off since the BoJ keeps buying, but the chart looks terrible. The banks have been buying put options, which says a lot (the "stupid gaijin" trade), and everyone is talking about the BoJ increasing their purchases sometime next year, so that risk is partly in the price already. It certainly isn't yet a widely held position, and I think we could trade another 10-15bps higher quite easily. 

Wednesday 18 December 2013

Fed to market : If you think we screwed up last time, just watch this...

It's interesting to compare the situation now with 2003/2004. If the drop in unemployment persists as it has for the last 3 years, we'll reach 6.3%, the level of peak unemployment in the dot com recession, around the end of next year :


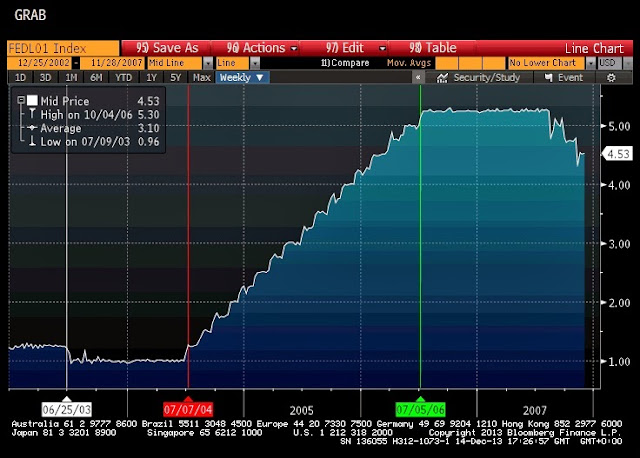
How should eurodollars be priced if the Fed subsequently reacts exactly as it did last time ? Well, they made their final cut to 1% in Jun03 as unemployment peaked, kept rates on hold for a year and then hiked in a straight line by 425bps over the following 2 years. Like this :


Matching the two dates of identical 6.3% unemployment suggests rates stay at 0.25% till Jan16, then rise to 4.5% by Jan18. Allowing 30bp for the funds/Libor spread, that gives 95.20 (4.8%) for Dec17 euros. EDZ7 currently trades at 96.80, ie 160bps too high (interestingly that's exactly where I'd expect the next selloff in EDZ7 to stop from a technical perspective : down 200bps from 98.10 to 96.15 over last summer, a 100bp bounce to 97.15 this autumn and then another 200bps getting you to 95.20-ish. Funny coincidence.).

Of course, there are some differences :
- Fed Funds are 75bp lower now than in 2003 : easier policy now
- the Fed is saying they'll keep rates low for longer than Jan 2016 : easier policy
- the Fed has ~$4trn of bonds on its balance sheet : easier policy
- the stock market is at an all time high instead of recovering from a crash : easier financial conditions
- GT10 is 3% instead of 5% : easier financial conditions

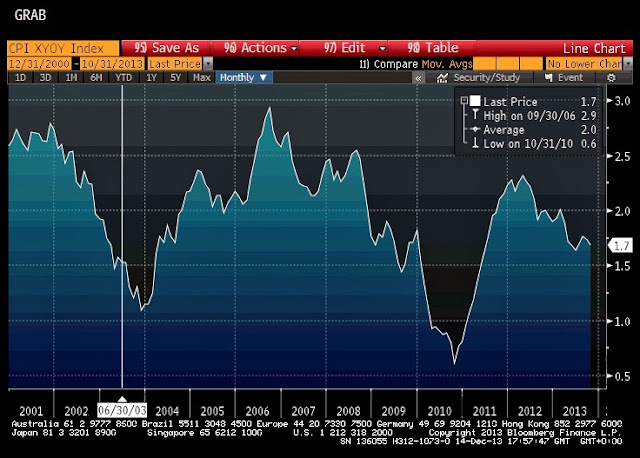
One thing that isn't very different is inflation. Here's core cpi :


Inflation is actually higher today than in 2003, so real rates are even easier than nominal rates. In fact current 10yr break-evens are almost identical now to their levels in 2003 as well.

Obviously the Fed made a colossal mistake in 2003-2007. They kept rates too low for too long and inflated a monumental bubble which nearly destroyed everyone when it burst. So how can the current forward guidance, committing them to even lower real rates for even longer, be credible ? It all comes down to inflation I think. If the core cpi numbers turn as they did in late 2003, then the Fed will start hiking rates soon. Within a few weeks everyone will be dusting off charts like these and drawing the obvious conclusion that the steady-as-she-goes sequence of rate hikes from 2004-2006 is a better-than-best case scenario, and that to prevent the risk of bubbles they really ought to tighten even faster. Which all points to EDZ7 and its friends being 200bps or more lower than they are now. 95.20 on EDZ7 strikes me as a best-case scenario.

Personally I think there's a significant chance of this realisation dawning on the market in Q1, as we post stellar growth numbers and everyone races to upgrade their forecasts against the backdrop of tapering. Low delta puts on the golds are the obvious risk/return trade. Ideally equities will fail again here at 1810 on spx, giving a risk-off trade with a great risk/return to set against the rates trade. The combination could be the trade of the year if it lines up.


Monday 9 December 2013

Nov update


indexed NAV
adjusted return
100.00
Nov-12 17.8% 117.77
Dec-12 37.4% 161.78
Jan-13 38.1% 223.40
Feb-13 -3.3% 215.92
Mar-13 12.4% 242.62
Apr-13 30.2% 315.81
May-13 68.8% 533.08
Jun-13 36.9% 729.55
Jul-13 -12.6% 637.46
Aug-13 -1.7% 626.31
Sep-13 -9.6% 566.31
Oct-13 -4.9% 538.62
Nov-13 11.5% 600.41

Having drawn down from Jul to Oct (my own fault in Jul and Oct, and also due to the Fed's disgraceful behaviour in Sept) I was uncomfortably close to my stop by the end of Oct. I'm running a 30% drawdown from peak month end NAV, so I was 3.8% away at the end of Oct and running correspondingly smaller positions than in Jun. After Nov I'm back in the clear, so I can trade more freely without being constrained by the proximity of the stop. The easiest market has been fx, as the market looked into Q1 and saw a tighter Fed and a BoJ which is likely to undertake another round of easing :

Equities            2.7%        Nikkei longs (aka USDJPY) worked, offset by a small loss from long VIX
Commodities   0.4%        Short gold again, having been stopped on the same trade in Oct
Fxd income      0.0%        Gains in Aussie bills and short TYZ3 offset by losses from short JGBs
FX                    8.4%        Long USDJPY, GBPCHF and short AUDUSD and AUDNZD all worked

I should have made more in equities really : after payrolls it was clear that the hedge fund community needed to reduce the performance gap with equities to avoid some difficult investor conversations. The problem is that the taper is coming though. Never mind the data - the guard is changing at the Fed and QE is Bernanke's pet, not Yellen's. She's more interested in optimal control and convincing the market that rates will stay low for another 3 or 4 years. Anyway, QE's days seem numbered, and even if you believe that this year's equity rally - powered by  multiple expansion - has nothing to do with QE (I don't) then you don't want to find out the hard way that you might be wrong. After a great year, and with a major change in the monetary landscape coming, common sense suggests reducing equity positions. So being long stocks feels to me like picking up the last few pennies in front of the steamroller : 2% of upside vs 10% of downside. Not very attractive, so I left the equity market in the US alone in Nov.

Current thoughts (in brief):
I'm now short equities, but concerned I'm too early. Vol has picked up, and the 1810 highs should be met with selling from some over-excited longs from a couple of weeks ago. Maybe that will cap the upside now. If not, I'll respect the rally and cut.

FX still seems the easiest market in my opinion. I'm short AUD, JPY and CHF against GBP, USD and NZD (small for the latter). My risk-off hedge is long Aussie Dec14 bill futures, as before. More and more people are starting to suggest a final cut in 2014, but even without this the position still works. What's clear is that the hurdle for  rate hikes is higher than people thought a few months ago. I think rates aren't rising for a couple of years at least and AUDUSD probably heads towards its 0.82 low from 2010.

Fixed income. I like being short JGBs, for the first time in ages : real yields are negative in Japan and positive in the US, and the gap is the widest since 1998. That's triggered the second largest flows into Treasuries from Japan since they started collecting the data in 2000 - in other words, Japanese institutions are voting on JGBs with their feet. Everyone believes Abenomics will stutter in the spring and require more bond buying from the BoJ, so it only takes a few signs of durable success to make them question that assumption. That would push JGB yields a lot higher (ok, 15-20bps higher anyway). The negative carry isn't so bad, and positioning seems quite clean. Everyone's afraid to fight the BoJ, but there's always a level where it's the right idea.
Elsewhere I'm running a medium sized short in TYH4, as yields seem set to drift just north of 3% with a Jan taper. To an extent it's the same as the JGB trade though.

Saturday 30 November 2013

Oct update


indexed NAV
adjusted return
100.00
Nov-12 17.8% 117.77
Dec-12 37.4% 161.78
Jan-13 38.1% 223.40
Feb-13 -3.3% 215.92
Mar-13 12.4% 242.62
Apr-13 30.2% 315.81
May-13 68.8% 533.08
Jun-13 36.9% 729.55
Jul-13 -12.6% 637.46
Aug-13 -1.7% 626.31
Sep-13 -9.6% 566.31
Oct-13 -4.9% 538.62


A very frustrating month here :

Equities               0.0%      Long Nikkei positions cancelling gains from S&P longs
Rates                   -1.8%     Shorts in US fixed income and small losses in Schatz & Bobl calls
Commodities      -1.3%     Stopped out of short gold at 1344, which turned a good trade into bad one
FX                       -1.8%    Stopped out of long USDJPY, short AUDUSD and long GBPCHF

Having sidestepped most of the US political noise I found it very hard to re-establish positions. Having had a large drawdown I'm running with much smaller positions and tighter stops. With hindsight, the positions should have been smaller still and the stops deeper : nearly all the trades I cut subsequently came good, so the lesson for November is to look for smaller positions on higher conviction trades.

Market outlook
US
October's first tier data (ISMs and payrolls) suggest that the real economy never believed the Washington pantomime. Perhaps Main Street is just as cynical as Wall street about the threats of US politicians. Either way, it's hard to see how Nov and Dec payrolls are going to be poor. That and the Fed's latest rhetoric (perpetually low rates should outweigh any taper) make me think that a Jan taper is most likely. I think the market basically "knows" this, but hasn't yet priced it in because we all got so badly hurt by the Fed's U-turn in Sept. Short gold, long the dollar (against AUD and JPY) and a small short in fixed income are all worth re-entering.

Japan
As things stand the impact of yen weakness on CPI will peak soon, but CPI is still a way from the BoJ's 2% target. Either Abe concedes defeat, or he makes another push to revive inflation. Defeat looks like political suicide, so my money is on another round of monetary stimulus. It's hard to buy more JGBs - they're already buying more than the annual net issuance - so the path of least resistance might be to buy more ETFs and equity index trackers. They'll be exploring the options for more easing at the same time that the Fed is talking its way to a Jan or Mar taper, so USDJPY


Tuesday 8 October 2013

Sep update

Sep update

indexed NAV
monthly return
100.00
Nov-12 17.8% 117.77
Dec-13 37.4% 161.78
Jan-13 38.1% 223.40
Feb-13 -3.3% 215.92
Mar-13 12.4% 242.62
Apr-13 30.2% 315.81
May-13 68.8% 533.08
Jun-13 36.9% 729.55
Jul-13 -12.6% 637.46
Aug-13 -1.7% 626.31
Sep-13 -9.6% 566.31

I feel like calling the US authorities and demanding my money back. I'd have put Summers for Fed chairman and an initial taper both as high probability outcomes, and obviously neither was. Having had a humiliating week in mid Sept, P&L preservation demanded a serious cut, so at least I've been largely on the sidelines during the current political fiasco in Washington.
I don't have a clear idea how to trade this situation - it's completely binary, driven by political egos and everything is correlated (so no good hedges that I can see). It beggars belief that the politicians will consciously drag us over the edge, but the gridlock and the dynamics in Washington are pushing that way. After all, everyone was aware of the risk of war in 1914 and no-one wanted it (well, maybe one did), but it still happened. I have some Schatz and Bobl calls 20-30bp OTM in case the unthinkable happens. The only long term position I'm keeping is long Japanese banks.

Things I'm watching with a view to enter when (if ?) the debt ceiling/shutdown is resolved :

Japan - people are starting to question Abenomics, which seems premature as you wouldn't expect it to be an easy straight line process. Offshore positions are being trimmed while domestic retail and institutional money are preparing for what could be the next leg (NISAs, GPIF asset re-allocation for example). BoJ seems to be talking down the JGB market and attempting to floor yields at 0.50, which sets up an interesting risk return there perhaps. I want to get the all clear from Washington first though.

Aussie - I'm out of the slowdown trade, as the data has bounced and housing seems to be following the NZ route.

UK - the recovery was looking great, until Osborne decided on a huge dose of adrenaline straight into the heart muscle (aka Help To Buy). Cue all 1 bed flats repricing to £600k. It seems unlikely to end happily. Being long GBP against CHF and AUD was a nice trade, but I'm now on the sidelines as explained.

USA - I'm concerned that everyone "knows" a default is unthinkable and that sanity will prevail. Markets are convinced that default is unthinkable, so they're not inclined to panic - but a market panic is the only tried and tested way to break a Washington logjam. So it's Catch 22, the downside being that if something goes wrong in this game of chicken then things fall apart extremely rapidly. Perhaps too rapidly for the authorities to react. The role of Treasuries as collateral seems to me the weakest link.

I'm out of the game till the odds are better.

Wednesday 2 October 2013

insurance trade

Generally insurance trades are a waste of money, but the House Republicans seem determined to test that idea to destruction. It's a ninety-something percent probability that the debt ceiling is fixed by mid October, but if it isn't then it's nice to have protection. The best I can see is schatz and bobl calls expiring on Oct25th.

If the politicians screw up, the US could be in selective default soon after Oct 17th. That will raise a question mark against the eligibility of Treasuries as collateral for CSAs etc, and there'll be a mad scramble for every other government bond as banks and hedge funds try to get hold of replacement collateral. That points to Schatz and Bobl calls. Surprisingly the Nov calls (25th Oct expiry) are cheap : 0.01 for the Schatz 110.70 calls and 0.02 for Bobl 126.00 calls. If the unthinkable happens Schatz will trade to negative yields - we were there last year after all, so the precedent has been set - and these calls are in the money. Possible payout ratios could be 50:1 or higher, which seems a lot better than anything available in spx puts.

The real purpose is obviously to provide the backstop to buy equities if/when things are looking really ugly. We're not there yet though.

Thursday 5 September 2013

Aug update

Aug update

indexed NAV
adjusted return
100.00
Nov-12 17.8% 117.77
Dec-13 37.4% 161.78
Jan-13 38.1% 223.40
Feb-13 -3.3% 215.92
Mar-13 12.4% 242.62
Apr-13 30.2% 315.81
May-13 68.8% 533.08
Jun-13 36.9% 729.55
Jul-13 -12.6% 637.46
Aug-13 -1.7% 626.31


Another frustrating month, especially in FX where I insisted on selling lows and buying highs again, but things seem to be picking up into September.

Ideas I like at the moment :

1. Long GBPCHF

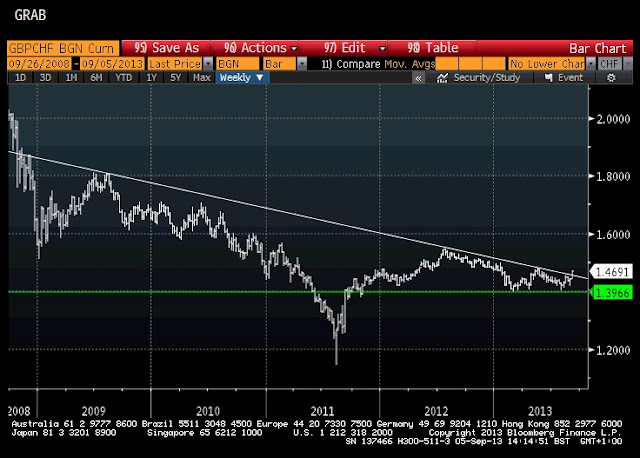
People are getting used to the the idea that the eurozone isn't going to collapse (yet), but EURCHF is still at historically expensive levels. As CHF will lose more of its safe haven premium it makes it an attractive short against GBP. Obviously there's no net negative carry to speak of, and the chart looks good, as we're breaking out of a 3 or 4 year downtrend. The 1.40 level is good support provided eurozone breakup is off the table :


It's really a doubly leveraged trade on eurozone recovery, as this is also one of the main reasons for the weakness of the UK economy since 2009. I prefer buying GBP to selling short sterling or gilts as the positioning seems cleaner and I don't want to incur the negative carry in the yield curve.


2. Resumption of the Abenomics trade

Japan still has some of the cheapest equities in the world, especially the megabanks. With very little fuss they offloaded a huge proportion of their JGBs on to the BoJ last quarter (almost half of them in the case of Sumitomo), and they're still on very cheap price/book ratios (0.75 for MUFG) and low p/es around 8-10. Just cheap then. Kuroda's commitment to further easing if the consumption tax slows the economy is important in underwriting the recovery, and USDJPY should be forced higher by rising US yields.


3. Aussie rates

The RBA may be taking a pause or done altogether, but either way the bill curve looks too steep. It's pricing 58bp between Z3 and Z4, and with all the PMIs in recession, retail sales growth stuck at zero and unemployment rising towards its 2009 peak that looks plain wrong. There are plenty of secondary reasons (mining capex cliff kicking in next year, some degree of fiscal restraint from the new govt and poor business confidence, eg the NAB survey). Further cuts next year aren't out of the question, but even without that this is my favourite slowdown trade. It's fighting the US rates headwind, but that's the reason for doing Z3/Z4 flatteners rather than just buying 3yr futures outright. It rolls down from 58bp in Dec to 31bp in Sep.


4. US yields

Last but not least, a Sept taper looks unavoidable now. The interesting question is, what next ? They've stuck so far to Bernanke's timetable (start tapering in Sept, finish by mid-2014), but the domestic data is turning out better than they expected, and the global data is far better. If anything that should bring the mid-2014 end date closer (and please don't suggest that Summers will stick to the schedule because he inherited it).*IF* they start with $10b in Sept, and pause in Oct to see the effects, then they have $75b to remove in at most 5 meetings. Alternatively they could start with $15b or $20b in Sept, or taper again in Oct. Any way you look at it, it's a more aggressive schedule than most people have been discussing, so it seems to me that when the market starts thinking about this on Sept 19th we'll have to sell off some more. Favourite trades here are short EDZ7 (still), covered puts in TYZ3 and FV/WN flatteners, ie 5/30s. And short some gold, just because it's had such a ridiculous squeeze.


Thursday 8 August 2013

July update

July was frustrating : after getting payrolls right and seeing a fresh high water mark, I was too slow to reduce in the face of the Fed's jawboning. As usual, when you start trying to defend P&L I ended up buying highs and selling lows, until I got fed up with my own wrong-headedness and cut properly just after mid month. Net-net, July ended up with a 12.6% loss, split between the following areas :

Equities
   UK               -0.9%
   Japan            -0.6%
   US                -1.2%
Fixed income
   US                -6.8%
   UK               -0.5%
Commodities
   Gold             +0.4%
   Copper          -1.8%
FX                   -1.3%

The driver has been US fixed income, not surprisingly. The data has been extremely strong in my opinion, payrolls notwithstanding. Rates did actually move marginally higher over the month, which makes a loss in this area even more inexcusable. New month resolutions :
- don't spend money on option premium
- run smaller positions
- don't trade reactively
Remaining positions are short AUD against USD and NZD, despite it being a very consensus trade, short EDZ7 and TYU3 and short gold again, all in less than half the size of late June.

All basic stuff. The most frustrating part is that if I'd had the discipline to do absolutely nothing at all I'd have made money in July. Time for a refresher course in trading discipline.

Wednesday 3 July 2013

Will Jun payrolls be the straw that breaks the bull market's back ?

We're on the verge of breaking a rather serious trend. This is the 10yr yield since 1980 (the secular bull market in fixed income, older than half the people currently trading it). If 2.50 goes, then watch out. Will Jun payrolls be the straw that breaks the bull market's back  ? 


After good-to-strong recent data (ADP, car sales, durable goods), and a 25bp rally in 10s to flush out the uncommitted shorts, the pieces could be in place for a move to new yield highs. The obvious near-term target is 3%, about the same 150bp selloff that we had in Jun 2003 when the market realised that the last cut had arrived and the next move in rates would be higher. 10y notes have sold off 50bp due to the FOMC (2.16 to 2.66), and retraced 25 to 2.41. A second 50bp selloff from 2.41 would get to 2.91. Presumably that needs a strong payrolls number, which might be what the strength in consumer confidence and spending is saying. *If* we get to 3% then the above chart suggests we're in very scary territory. 


Here's a slightly biased perspective on current data :

5 yr highs                                                                               5 yr lows

Consumer confidence
Michigan, Bloomberg, Gallup, Conference Board

Housing market
NAHB index, permits, new home sales, Case-Shiller,
     S&P Comp-20 YoY change, existing home sales

Labour market
JOLTS job openings 3mma                                                   Jobless claims 4wma, unemployment rate
Gallup job creation index

Misc
Vehicle sales, NFIB optimism

and just for the record :
Fed balance sheet                                                                   Fed Funds rate 


What weakness there is comes from China, the Gulf, perhaps the Eurozone, and lagged effects of the sequester. I'm only really concerned about the first two.

The point is that broad swathes of the US economy, covering housing, consumer confidence & spending intentions, the labour market and business confidence, are recovering strongly, while monetary stimulus remains at full throttle. The Fed have stepped away from the controls and are claiming they won't come back before 2015. Fixed income had a wake up call last month, but 10s at 2.50 aren't cheap : how many investors who were bullish or confidently sitting on carry trades two weeks ago have had time to adjust to a bearish mindset ? Usually the shock of a loss takes longer than a fortnight to heal, so I think the path of least resistance is towards higher yields as people re-position themselves for a tightening Fed.
The "brave" trade here is to maintain a short into payrolls : buy short dated put spreads on TY and US and buy back the lower strikes of any longer dated put spreads in the hope of re-establishing them at much better levels. Actually it's not really that brave - the risk/reward based on the chart above makes the short trade the easy one. The scary trade here is to be long.


Sunday 30 June 2013

June update


    Month    Mthly return       NAV

15Nov12100.00
Nov-1217.8%117.77
Dec-1337.4%161.78
Jan-1338.1%223.40
Feb-13-3.3%215.92
Mar-1312.4%242.62
Apr-1330.2%315.81
May-1368.8%533.08
Jun-1336.9%729.55


Overall view
The Fed is sticking to its party line : no hikes till 2015, but tapering in September, data permitting. After Stein's speech that sounds disingenuous. They're going to base the tapering "decision" on the accumulated data since QE3 started, and they're de-emphasizing individual payroll releases. That suggests that the decision has already been made, well before they went public a few weeks ago (hardly surprising given the stakes involved). It raises the question of whether Bernanke has lost the backing of the FOMC for QE3. Perhaps the leadership is still in favour, but the troops are rebelling. Lame duck or not, it's a Treasury bear market, and with more tapers in the pipeline and QE3 ending next year, the long end is a sell on rallies at least until Sept. Foreign central banks have got the message and are already selling in size. We've had a huge move though, so probably it gets harder to trade from here.

An interesting question is this : how different is this recovery from "normal" ? Usually rate sensitive sectors like housing and auto sales lead the recovery (tick), followed by increasing corporate investment (tentative tick), and a precautionary buildup in inventories, then falling unemployment (another tick) before finally consumption picks up the baton. The Fed would start hiking a year or so after the recovery started, once falling unemployment was well-entrenched. Aren't we there already ? If so, then 2015 is a wildly optimistic estimate for the first hike. 18 months from today. Really ? Ok, so GDP growth rates are well below normal, but you wouldn't know it if you looked at the unemployment chart. Anyway, GDP stats are notoriously prone to revision. 
Even worse is the Fed's inability to restrain the credit cycle. Normally commercial banks don't hold meaningful excess reserves at the Fed, so the Fed can easily curb excess credit growth, either by hiking rates or raising reserve requirements. To do that now, they need first to reverse much of the cumulative QE (all 3 rounds of it), as until then the banks will have excess reserves which they can lend freely if the demand is there. Or they could raise IOER out of the blue (the 1994 scenario). The Fed have checkmated themselves, just as the economy starts getting traction. They might turn out to be well behind the curve by the end of this year. Of course Bernanke won't be around to deal with the problem. In their shoes I'd be quietly praying for a Chinese hard landing to get me off the hook. The risk premium in the 2016-2018 part of the ED curve could go through the roof in this scenario.

The short trade in treasuries works if US real rates keep rising. The threats come mainly from China, which I've covered by shorting AUDUSD and copper. If the Fed miraculously turn dovish for some other reason then equities should explode higher, and I think that's best covered by a Nikkei long (which is now purged of excess positions I think, and which should work even in a treasury bear market provided usdjpy resumes its climb). My favourite equity market is Japan as explained, and I have a small short in SPX. Nothing in FTSE for now, though I'd buy it rather than selling it here.

Specific trades.
Gold : I've closed my remaining gold short on this collapse, and will wait for a rally to re-establish. I could envisage a stand-up fight between bulls and bears somewhere between 1000 and 750, where we decide who's right. In essence, should gold be at 200 or 2000 ? Until then the primary direction is lower, but we're well oversold so I'm on the sidelines for now. Gold made up 20% of June's performance.

Japan : I can't see usdjpy going down and staying there, with the Fed tightening and the BoJ easing. Now that spec positions have been purged (did they clear the decks for half year end ?), the path back through 100 seems open, and the Nikkei is a buy. This is probably my favourite reflation trade in the current environment. Japanese retail have few other options as inflation rises, and the quasi-govt institutions are being herded into equities by the bureaucracy.

Treasuries : Still a bear market in the long end, although the short end will be supported by Fed rhetoric (until it isn't !). After the FOMC I covered some of my outright short by buying covered calls in EDZ4, selling short Dec 99.375 calls for 10ish bps versus futures, against bearish positions in TY and US. Half of this month's return was US fixed income, so I've taken some profit on EDU4/U5 too. 

Copper : short, looking for a break of 3.00 in HG1. This is another expression of the short AUD trade, but without negative carry and more focussed on china. Flat this month.

Australia : still short, and just trading around the core position by buying a little back on really bad days. A third of June's return was Aussie.


If the easy moves are over, then having a plan and staying disciplined is going to be even more important than usual. Easy to say, not so easy to do.

Friday 21 June 2013

Dammit Jon, those Dec14 euros are 20bps too low, I tell you. Talk them up, there's a good chap !

The selloff in treasuries is on the brink of becoming self-propelled - classic VaR shock stuff. The Fed is trying to micro-manage the short end with these Hilsenrath articles. Volcker and even Greenspan must be quietly seething as they watch this farce, but the attempt to stop rate hikes being priced in only underlines the message that tapering is on the way. Steepeners are the path of least resistance : I like EDZ4/Z7 more than U4/U5 at these levels, but it does suggest selling 10s and bonds against red EDs. Pimco etc are long and wrong here, and clearly aren't out yet, so rallies in the long end are to be sold. 2.5% for 10y yields is too good a risk/reward balance to be sustainable (should be about 20bp higher I'd say). Everything will presumably rally out of sight on Monday after Hilsenrath's pronouncements, so maybe next week will be the window of opportunity to sell the long end before payrolls the week after. The real threat to tapering comes from an equity collapse, so I'm short SPX now.

Copper is increasingly interesting. LME stockpiles are at a 10 year high, and supply - expected demand is projected to triple this year from last. That can only get worse if China's landing turns out to be as hard as it's looking. Why would the new regime back off now ? They have one opportunity only to squeeze some excess from the system and blame it on their predecessors, and that isn't a 2 week process. There'll be false glimmers of optimism along the way, but it seems to me we're into a multi-month tightening in China. With high inventories, prices sitting on a multi-month support level and a hawkish Fed, copper should be set for a break lower. Short now, with a view to selling more if we drop through 3.00.

I've pulled out of Japan entirely (took profit on usdjpy longs and a small long in nikkei), but on reflection maybe usdjpy is still worthwhile, with the two central banks heading in opposite directions. I'll avoid the Nikkei as I don't think this is an equity friendly backdrop.  I'm flat in GBP and the eurozone, but keeping the short audusd trade, and reducing my gold short. It's dangerous to have too many moving parts when it's this volatile.

Thursday 20 June 2013

copper

First thing to admit is that I know nothing about copper per se...

However, the Chinese shibor squeeze seems to be serious, and apart from selling audusd, which I already have on, copper seems the perfect trade. Add a hawkish Fed, and a chart that reminds me of gold in the way that it's been more-or-less supported at 300 for a few years (like the 1530 level in gold) and the risk return looks promising. It's not as clear as gold, where there were massive retail positions and inflation was falling rather than rising, but the degree of consensus about Chinese growth is not dissimilar to the way people spoke about gold a few months ago. It doesn't seem a crowded trade (no-one's mentioned it to me at any rate), so I think it can have a clearout here. Target 2.50 perhaps ?

A bit more homework is needed before making it a "proper" position, but I'm shorting a little bit here. Sell HGU3.

Friday 7 June 2013

Back to the Old Normal ?


A very ugly close, for a payrolls number which shouldn't have been that bad for fixed income. Look at the rolling 6th vs 10th contract (ie EDU4/U5) back to early 2009 :


Where we are now - about 50bp - was the floor until mid-2011, since when it has been the ceiling. (Incidentally you get the same picture, with the same dates, if you look at 10y yields or 30y yields - we're talking about the entire treasury market here, not just one obscure spread). I think that until mid-2011 most people believed we were still operating in the Old Normal, and the US would get a standard recovery (remember all that U/V/L debate ?). If you suggested that the US was in a Japanese style slump (L-shaped), people laughed at you. After mid-2011, with the extended period commitment for zero rates, Op Twist and open-ended QE3, L-shaped has become conventional wisdom, and the world has invested accordingly.

So *if* the labour market, retail sales and private capex hold up in the face of the sequester etc, then it seems that we're crossing from the New Normal (L) back into the Old Normal (U or even V). In that case this spread ought to head towards 100bps - which funnily enough is where the front calendar spread traded in Japan as they exited ZIRP in 2006. Hilsenrath's article today suggests that the Fed is going to taper in Sep or Dec, and the market will extrapolate that into rate hikes a year later.

We're basically at the cusp between two entirely different views of the world, and so vol will go through the roof. A couple more decent US numbers and they'll be throwing in the towels thick and fast.

Saturday 1 June 2013

May update


      Month    Mthly return       NAV

15Nov12 100.00
Nov-12 17.8% 117.77
Dec-13 37.4% 161.78
Jan-13 38.1% 223.40
Feb-13 -3.3% 215.92
Mar-13 12.4% 242.62
Apr-13 30.2% 315.81
May-13 68.8% 533.08

May was obviously one of those months when just about everything goes right, unlike Feb. I left the Nikkei party at 14000 (a bit early, but not complaining) and switched from long usdjpy into short audusd around 1.02. Bernanke fired the starting gun for a fixed income bear market which could have much further to run, and gold turned down as hoped from its rebound near 1475. About the only thing that didn't work was being long cable, but that stopped out at zero cost, so could have been much worse.

Looking forward, the trades with momentum are audusd (lower) and US fixed income (rates higher), which overlap on the US side. The Chinese steel inventory liquidation is getting serious, so iron ore and coking coal seem to have further to fall. Gold looks precarious, but crude and copper are treading water, so it's -3 on a scale of (-5,+5) for Aussie's terms of trades. The miners are thinning and stretching out their capex pipeline - the term is spaghettification -  so the 1% GDP tailwind is turning into a similarly sized headwind. How will they finance the c/a deficit as the capex inflows fall off ? In addition,  how many investors without an EM mandate are long audusd as a surrogate for China exposure ? It's hard to find bullish factors for aussie at the moment.

(A wildcard is the Sept general election : Labour look set to lose, having screwed up the fiscal position, so it might be politically expedient for the Liberals to run on a fiscal responsibility platform. In that case Australia could be getting a dose of austerity just as the capex cliff kicks in, which would only mean one thing for the RBA and audusd.)

US fixed income is all about May and Jun payrolls. If the labour market holds up (which is what the strength in consumer sentiment might be suggesting), then the Fed's rhetoric about tapering will continue, possibly aiming for a taper in the Sept meeting. They've been notably quiet about the recent selloff - tacit approval, perhaps ? Is this the dog that didn't bark ? I think so. My favourite trade here is a u4/u5 steepener, with a target above 60 (this could be the front calendar spread as rate hikes come on to the agenda, and since we're starting from zero I think we could see 100 or higher as the market starts to consider how far the Fed has to travel). Also short EDZ7 and long some low delta green Jun and blue Jun puts, just in case there's a blowout payrolls and the bond market goes into liquidation mode. It'll happen one day.

Japan will be interesting again soon. Right now, it's almost un-tradeable, with 500-1000 point swings in the Nikkei every other day. At least some of the selloff must be a month end effect - we were up 16% at one point this month, so there's some reallocation to be done. And there's the inevitable shakeout after a 70-80% 6 month rally. However the LDP doesn't want to go into elections with the Nikkei having a fit, and they seem to be strong-arming GPIF, Yucho, Kampo and the more docile private sector investors to support equities and take the pressure off JGBs. Fairly soon the storm should blow itself out, and there's a trendline coming in from the start of this rally at about 13000, so I've tentatively sold some July 13000 puts as a first step towards buying the dip. In 3 months' time this *could* look like nothing more than a "healthy"correction : a market that rallies 75% in 6 months is going to have 20% corrections instead of 5% ones, but that doesn't make it a bear market. Incidentally, there's a lot of confused thinking about JGBs. If JGBs collapse, how can the currency rally (they're collapsing because of fiscal sustainability concerns, not because of an imminent cycle of hikes after all). And if the yen falls, the exporters are in even better shape. Obviously the banks will have 'issues' (although they've shortened duration hugely after 2010), but ultimately they'll be bailed out by the Govt if necessary. Too big to fail. A 20 year JGB bull market was hardly wonderful news for equities, so perhaps a JGB bear market will be ok.

Elsewhere, I'm completely out of FTSE and SPX, but still sitting with AAPL, which seems to have quietly put in its first higher low in a year. When they eventually release a new product, perhaps the market will look at the chart and the p/e and feel uncomfortably underweight. People will always need iphones, after all !

Wednesday 22 May 2013

Bernanke testimony a watershed ?

The Fed finally acknowledge the possibility of tapering & QE exit. Barring weak data, I think equities run into the sand here, so I've cut all my FTSE long this afternoon, sold some S&Ps to offset my AAPL long (not at a great level) and to keep a semblance of balance, covered half of my short in EDU7 and all my jgb short.

Basic view is that the dollar rally continues (so keeping the short in audusd, the long in usdjpy and the Aug put spreads on gold), and that the bond market needs to probe the upside in US yields. Perhaps 2% becomes the floor in 10y yields, and we set up for a test at 2.35-2.40 (obvious when you look at the chart). I don't see how equities can ride out the uncertainty of an end to QE3 in the meantime, and the direction of most pain now seems to me lower - so net short stocks, for the first time since I can't remember when.

Another trade I like is buying EDU4/EDU5 below 40bps (currently 37). It's a big if, but if the Fed starts tapering in Sept (so they can see Jun and Jul payrolls before starting the communication process at Jackson Hole and Humphrey Hawkins in Aug), then they could reduce in 20bn increments every 3 months and terminate QE3 by next Jun, when it looks as though unemployment will hit their trigger of 6.5%. In that scenario, U4/U5 should be closer to 75bp, so perhaps 50-60bp risk-adjusted. The low in the last 2 years is 23bps. Scale in from 37 down to 28bp.

That timetable looks persuasive to me since Bernanke retires in Jan 14 and has to hand over to Yellen or whoever else it turns out to be before then. The big unknown is what the economy (& the stockmarket) does in the face of higher yields. Cross that bridge when we come to it...

Monday 13 May 2013

Mid-May update

Trying to update every trade is too labour intensive, so I'm going to restart this with a monthly summary and occasional updates when appropriate.

First a summary since starting :

                           monthly
            date          return          NAV
Nov-1217.8%117.77
Dec-1337.4%161.78
Jan-1338.1%223.40
Feb-13-3.3%215.92
Mar-1312.4%242.62
Apr-1330.2%315.81

Current views :

The US has shrugged off the sequester and the fiscal cliff and is finding its footing. Higher US real rates in the months ahead are starting to be telegraphed by the Fed but the markets haven't yet priced this. Until this idea really sinks in (perhaps it needs a few more Hilsenrath articles or a series of speeches by Bernanke/Dudley/Yellen), equities will continue to rally on the back of QE3/BoJ liquidity. I want to remain long stocks and also have trades for higher US real rates.
Japan's recovery is still under-owned (esp by Japanese retail), and the UK economy is better than the market realises. The FTSE trades very well (retail is apparently very bearish), and I'd like an opportunity to add a position here.
Europe is a confusing mess and I'll avoid it at all costs.

I was pushing pretty hard on risk-on trades till late April, but have switched to a more balanced stance by shorting audusd (and even buying some puts on NKY and ESM3), which should work if there's a deflation scare here. I don't think there will be, and it works for many other reasons, but it's good to have that angle covered better than before.

Primary positions :

Long EDZ4/EDZ7 steepener, with covered calls sold against the EDZ4 leg (99.50 short dec calls) to improve the carry and cushion the effect of a selloff on the EDZ4 leg.

Short audusd. The main post-GFC safe havens (usdchf, usdjpy and gold) are all down ~25% from their mid-2011 peak. Audusd is down 10%, has an election this Sep (tighter fiscal policy from the Liberals ?) and the PMIs have collapsed. China appears to be switching to a less resource intensive phase of growth, and is anyway at risk of becoming credit constrained. Could audusd drop another 10-15% here ? The terms of trade are eroding, and 80% of the c/a deficit is being financed by LNG capex flows. Very unstable.

Long usdjpy - no need to spell this out in detail. Have taken profit on 2/3 of peak position, so will trade it more opportunistically now.

Long Japanese stocks. Have closed out my Nikkei position (too soon unfortunately), but still quite long the megabanks, Nomura and the shipping companies (8306, 8308, 8316, 8411, 8604, 9101, 9104, 9107). Wondering whether to buy Sony/Panasonic/Sharp too. Japanese pensioners will presumably buy the bluest of Nikkei blue chips when they are forced back into the market, and the megabanks and brokers control the retail distribution channel. Obvious.

Short gold. No need to spell this out either - the chart says it all. It looks like it's entering the second down leg after rebounding from its April collapse, which should target around 1200-1250. Took profit on half my position, but still running a reasonable 1400/1350 Aug put spread.

Long AAPL. How can it go down much when they are going to buy back 15% of the outstanding stock ?


Secondary positions :


Short JGBs - a short term trade for a few days around the auction cycle. Not wedded to this at all, but the chart does look ominous. Not a propitious sign for global fixed income.

Long some 1wk 1600 ESM3 puts. Just in case
Long some Nikkei Jun 14000 puts. All the HFs are on the same side of the boat right now.

Long gbpusd, so that some of my audusd is in fact gbpaud, but on a tight rein. No sense trying to pick a serious fight with the usd rally.

Wednesday 20 February 2013

Wed 20th

NAV 120.2

Gilts
Some nice fills of 2 GTC orders in gilts to start the day :

sell 5 at 115.95
sell5 at 116.45 (!!)       now short 40.

The market spiked up on the headlines about King voting for more QE, only to end the day down 0.22. Now short 40 G H3, and working a single bid for 5 at 114.25 (GTC).

GBPJPY
Although I think they're wrong, the market is taking a stick to GBP. I suspect the GDP data is rubbish and the employment data is telling the real story, but I'm not fighting it yet, so cut the gbpjpy position (again)

sell 0.5m gbpjpy at 143.062. Now flat

Tha's the second buy high/sell low that I've now done in gbpjpy, which tells me I should stop trading this cross for the moment.

Gold
Having said previously that I now had 100% of the position I wanted in gold, I think that exiting the gbpjpy trade makes room for a little more. A rather sloppy piece of execution after the Fed minutes, selling down $45 on the day. I should have been patient and waited for a better level tomorrow as everyone calms down.

sell 2 gcj3 at 1559.5. Now short 15.

T-bond futures
Same as the gold trade. Appalling execution, selling down on the day after the FOMC minutes. A true D-.

Sell 2 USH3 at 142-27. Now short 15.

I think both of these trades (gold and t-bonds) will be fine in the end, but the contrast with the execution in gilts where I sold the high tick of the day is pretty stark. Sure enough, both these trades ended the day in the red, whereas my average sale in gilts today closed almost a point in the black.


BIG PICTURE

The Fed is starting to think about the exit, and their discussions will be on this topic. This is toxic for the assets which have gained from QE, so we should be trading bear markets in yen (already largely complete, with a 20%+ collapse since November), gold, followed by long dated treasuries and finally eurodollars. Perhaps we trade a range in equities too (after all, the reason the Fed can even think about exit is because the economy is in reasonable shape, which is not the stuff of equity bear markets. Besides, I don't think the positioning in stocks supports a real bear market here, unlike gold, treasuries and EDs).
Tues 19th - nothing to report. NAV 117.9

I'm increasingly convinced that the correct trade is to replace a yen short with a short in gold (both against usd). Gold trades as though the stampede for the exit is just beginning - the trepidation is almost tangible in the price action - whereas in yen I'm starting to find myself buying highs and selling lows, which tells me the trend is faltering and it's entering a range for a while. Time to head to the exit on gbpjpy and usdjpy then.

New trades, Monday 18th

NAV 114.9

 I'm now short 20 of the Simex Nikkei 08Mar13 11500 calls, which doesn't make any sense given that I'm bullish nikkei and that expiry is right ahead of fiscal year end (this is what happens when you leg out of call spreads : stupid), so this gets closed out :

buy 20 NIH3 Mar13 11500 calls at 215

Also I felt as if the yen was going to make a serious assault on the barriers above 94.50 now that G20 is  out of the way, so reset a long there :

buy 0.5m gbpjpy at 145.80
buy 0.5m usdjpy at 93.955

Monday 18 February 2013

Took a painful drawdown on Friday ahead of G20 and reduced positions, which was a mistake in hindsight. Friday trades :

Sold 1m gbpjpy at 142.623
Sold 20 NIH3 11000 Mar calls at 371
Sold 10 G H3 at 114.72
Sold 3 USH3 at 143-13

The last 2 trades re-established shorts in gilts and T-bonds, albeit at a very poor level in gilts (quite oversold).

The gold trade look more compelling the more I think about it. Price action was awful on Friday obviously, and the market has broken through an uptrend from 2008. It could bottom and recover, but the environment looks hostile to gold to me for all the reasons discussed before. The price rallied from 682 post-Lehman to 1921 in late 2011. Obvious 38 and 50% targets for a healthy pullback would therefore be 1450 and 1301. Since it feels like kicking on an open door, I'm taking a risk and betting that we won't have the squeeze back into the old range (above the trendline mentioned earlier), and so I'm increasing my gold short to full size right here :

sell 3 gcj3 at 1619.3

sell 10 gck3 may 1700 call at 11.0 (expiry 25Apr13)
buy 10 gck3 may 1560/1510 put spread at 10.0

buy 30 gcq3 1400/1350 put spreads at 3.7 (expiry 25Jul) - cheap, but 12:1 for a real collapse over the summer.


Fri 14Feb13 NAV 111.6


Thursday 14 February 2013

Filled on gbpjpy bid :

bought 0.5m at 144.07

Now working 2 GTC offers :

0.5m GBPJPY at 146.93
0.5m GBPJPY at 144.93

Separately, got filled on the GTC bid for 5 more gilts, and decided to cut the JGB short (BoJ will eventually extend to 5yrs or longer. Probably we're going back to the all time high from Jun03 in JGB futures. In the meantime use the disappointment from the BoJ's decision today to close the position) :

bought 5 G H3 at 114.85
bought 10 JGBH3 at 144.04

Gold sold off again. It's starting to look terrible on the chart. Sold another 4 last night :

sell 4 GCJ3 at 1642.1

so now short 7 altogether.

NAV 114.8. Ouch.

Wednesday 13 February 2013

NAV 13Feb13 117.6

So much for range trading gilts. Got hit on the GTC bid at 115.95 earlier today, only for them to crash out through the bottom of the range. Still have 5/6 of the position though, next bid is 114.85 for another 5. Hopefully will get hit late in today's session, and be able to sell them back out on a bounce tomorrow as everyone reconsiders. I still want to be short gilts for another 15-20bps ideally.

Other trades today :

1. Got hit on a bid for 5 ush3 at 142-16, taking profit on 1/3 of the bond futures I'm short. Now short 10 ush3. Working nothing at the moment, but should probably cover some more another point lower.

2. Added to Sirius (SXX.L). It traded down 13% this morning on a story about delaying the detailed feasibility study for their potash mine and the resignation of one of the senior staff. Looking through the details, it seems to be a storm in a teacup, so added another 25,000 at 25.25. Total position now 250,000.

3. GBP is getting whacked because of King's comments (ostensibly). I think it's more likely that what's happening is that the flight to safety positions from the EUR are now stopping each other out, aided and abetted by a decent short base from fast money. The data doesn't seem so bleak : rising house prices at last, and strong private car sales. On top of which, there's been a dramatic easing in financial conditions in the UK since November, which won't be visisble in the data yet, but should start to appear in 4-6 weeks time. With Cameron's leadership how can we go wrong ? Anyway, added another clip of gbpjpy :

bought 0.25m GBPJPY at 145.35

Next stop 144.07 for 0.5m, GTC

4. After cleaning out the ESH3 15Feb covered calls I bought 20 ESH3 outright. They've rallied about 8 points (a nice start), so take a little profit and add some time decay by selling covered calls against these too :

sell 20 ESH3 15Mar 1540 calls at 9.00

That's a 33 delta. If we get there by expiry, then the Mar28 1520/1570 call spread (on ESM3, currently 1514) will be making a lot of money, so no regrets involved in being exercised if it happens. And if it doesn't then I have an extra 9 point cushion on the downside. 
bought 5 g h3 at 115.95. Try to trade the recent range in gilts. Work new GTC order

sell 5 at 116.45 GTC

Tuesday 12 February 2013

NAV 115.0 12Feb

bought 0.25m gbpjpy 146.415 : rebuilding yen short on today's weakness. I think headline dips in yen crosses are buying opportunities for the next few weeks, unless positioning is at extremes, which isn't the case at the moment. This is very much a toe-in-the-water position, which could be increased several-fold if necessary. On balance I prefer the Nikkei trade for Japanese reflation (since the Govt is starting to jawbone it higher), so this position is just to make sure that I buy gbpjpy after a selloff rather than after a huge up-day.

Monday 11 February 2013

I've been watching gold for a while. If the US is recovering (I think the evidence is becoming convincing), then the era of declining US real rates ought to be over. In other words, we've had the final Fed easing (QE-infinity), and from here on it's tightening at the margin.

There have been 3 clear beneficiaries of falling US real rates, in my opinion : the yen, gold and long dated treasuries. Other candidates, like the euro, copper or equities for example, have all had some flaw which has counted against them (respectively, the flawed structure of the EU, dependence on industrial demand and hence reflation, and risk appetite). The first 3 caught the full force of Bernanke's easing.

The yen has already started to slide. It can't be as good a short now as at 77. I'm short some fixed income, but it's still too early to go to town on it perhaps (the Fed is still buying via QE, and it's negative carry, and there's lots of talk about Treasuries being in a bubble : not an ideal backdrop). Gold is a different story. It's never been more widely owned as a retail investment. Its bull market has been running in earnest since 2002 - about the same time that equities peaked, more or less. No-one appears to think gold is a bubble, or if they do they're either too embarrassed to say it out loud, or ignored when they do. The point is, the idea that gold might be a bubble is far from a mainstream one.
Finally, it's already come off its high. No-one who bought gold and held it in the last 6 months (and a hell of a lot of people have done exactly this) is in the black. Another $100 lower and everyone who bought since Jul 2011 is under water.

To cut a long story short - sell gold. It hasn't decisively broken, so dip a toe in the water, and hope to be able to get some more sold at higher levels. It might even be worth selling the 1700 calls perhaps...

sell 3 GCJ3 at 1646.30

GTC orders :
sell 2 GCJ3 at 1676.00
sell 5 GCJ3 at 1699.20
new trade today

sell 15 ush3 at 143-18

NAV 112.3


a proper washout in jpy on Fri morning then. Stopped out of my remaining position in gbpjpy at 145.645 (ouch) as a precaution. Don't want to be washed out by a deeper pullback.

Other trades on Friday :

1. EDZ4
Take advantage of the push higher in fixed income to reset some shorts in eurodollars - so

sell 25 EDZ4 at 99.39

these were the ones that I bought back at 99.32 a few days ago, so my EDZ4/Z7 steepener is now more of an outright short than a steepener (+50 EDZ4 vs -125 EDZ7). I'd be fully short if we go much higher, so working orders to sell EDZ4 at 99.47 and 99.49 GTC. The contract high has been around 99.50, and I think it's really hard to get higher than that in the near term. Where to buy EDZ4 back again ? Probably in the low 30s and then more in the mid to low 20s.

2. ESH3
I covered the remaining tail risk from the synthetic short in 15Feb 1470 and 1475 puts, so

buy 50 ESH3 15Feb 1470 puts at 2.00
buy 50 ESH3 15Feb 1475 puts at 2.00

That leaves me with just a 28March call spread in e-minis (100 * 1520/1570 call spread, paid about 12.5 net). Ideally I want to sell the Mar28 1460 or 1470 puts against this to pay for the time decay, but this isn't the right level of the market to be selling puts, so we'll keep that powder dry for the moment. To maintain a long in e-minis, just added some more futures, on the break of the 'ceiling' at 1507 :

buy 20 ESH3 at 1512.75

3. NIH3
The selloff in usdjpy feels like a proper Friday clearout, and has been amplified (as usual) in Nikkei futures. So I'm resetting the jpy short by adding more to the Nikkei position :

buy 5 NIH3 at 11,145


After all that, probably not much net change in my risk position, replacing long gbpjpy with long nikkei and short EDZ4.


Thursday 7 February 2013

Incidentally, the claims number looks ideal for equities. Like payrolls, it puts the Fed firmly on the sidelines, and maintains QE3/4 at 85bn per month for the foreseeable future. That's a nice backdrop for a continuation of the rally - for now.
Carney appearance was a damp squib, as expected. Unfortunately there's been no spike in short sterling tosell into, although there was in gilts at the open this morning, so I've taken the opportunity to increase my gilt short from 20 to 30 contracts, ie

sold 10 G H3 at 116.17

This is in line with the aim of switching the short in L M6 in to a short in gilts from a few days ago. The carry is less painful, it doesn't fly so directly in the face of 0.5% rates and takes advantage of the poor budget fundamentals (which are arguably a positive factor for  L M6) and the crowded safe haven positions in gilts from the last 2 years (which probably now needs to be unwound or reduced).

And there's the wildcard of how the Bank intends to exit its QE holdings - not that I'm holding my breath for a sale announcement, but the lurking threat of something being announced is far from being priced into the mkt.

Wednesday 6 February 2013

NAV 06Feb13  114.9

Bought 5 NIH3 at 11,330. Now long 30 NIH3, in addition to the 11k/11.5k March call spreads.

Bought 100 L M6 at 98.66 - closing this out temporarily since Carney is speaking tomorrow. Will probably be a damp squib (does he really want to rock the boat before he's even got the business cards ?), but I'd hate to see the short sterling strip trading 8 higher and feel unable to short it. Will probably work an offer at 98.70/73/76 over the speech.

Bought 25,000 Kawasaki Kisen (9107.JP) at 182.6. The shipping lines are 3 of the worst performing shares in the Nikkei since 2008 (I think they have 2 of the bottom 10 slots, along with the likes of Sharp and TEPCO, which gives you an idea of how beaten up they are - and arguably how overpriced they were in 07/08). Anyway, it's a dash to trash, and they don't come much trashier than this, so I want to be really long this stuff. Seriously though, these were among the most heavily shorted stocks in the Nikkei, and are on stupid p/b ratios. The whole industry is going through a Darwinian survival-of-the-fittest episode, and the survivors are going to have a cost base that will make them wildly profitable in a few years time. Just copy John Fredriksen.

Tuesday 5 February 2013

tok advantage of the selloff in esh3 to roll the strike on 28Mar 1540/1570 call spread a bit lower : so in other words, bought the 28Mar 1520/1540 call spread for 6.25. Position now is the 1520/1570 call spread, for a total cost of 12.75 (this was 4th Feb trade date)

Also added a third to the Japanese shipping lines :
bought 15,000 9101.jp at 217.4    (total now 55,000)
bought 10,000 9104.jp at 296.0    (total now 40,000)
bought 20,000 9107.jp at 167.0    (total now 75,000)

Also added 0.25m gbpjpy at 146.87

NAV 05Feb13 110.2


Friday 1 February 2013


Start of a new month, so updating positions and thoughts – hence something of an essay.

NAV cob 01Feb13            110.7
                                               
GBP
            Single stocks
                        BP.L                        Long 10,000
                                                Short 10 Mar 470 calls
                        RR.L                        Long 7,000
                                                Short 7 Mar 920 calls
                        ELTA                        Long 3,500
                        PIN                        Long 6,500
SXX                        Long 225,000
           
                        The rally has effectively closed out the Rolls Royce long (deep in the money now) and BP is going the same way – depending on what happens with the negligence case in the US courts. Electra and PIN are still trading at unjustifiable discounts to NAV, even though every business they sell is going at a premium to NAV, so I’m keeping these for now.
Sirius is pure option premium. They need regulatory approval for a potash mine in Yorkshire – if they get it they’ll have a great position as a low cost producer of potash, bringing a lot of employment to a deprived area (amongst other things). High risk, but at least 4:1 on the upside in the long term.
No changes imminent here – if the rally closes out the BP and Rolls Royce positions that’s fine, if not then wait till expiry and sell covered calls again.

            GBP rates
                        Short 100 L M6, average price 98.735.
                        Short 20 G H3 (March gilts)
           
                        The short in gilts seems a better way to express this trade than short sterling, given the supply/demand situation, the likelihood that further UK easing is more likely to be FLS than QE, and the fact that the gilt market is crowded with flight-to-safety buyers who are realising that they’ve been running into the burning cinema rather than out of it.  I think this argues for switching the L M6 position into gilt futures when the opportunity arises.

JPY
            Single stocks
                        8316                        Sumitomo Mitsui            long 2000
                        9101                        Nippon Yusen                long 40,000
                        9104                        Mitsui OSK                    long 30,000
                        9107                        Kawasaki Kisen             long 55,000
            Nikkei
                        NIH3                           long 25 (Simex Nikkei)
                        NIH3 11k calls            long 20
                        NIH3 11.5k calls         short 20
The Nikkei still looks like the equity market with the greatest upside, as it’s chronically under-owned and ridiculously cheap, more so relative to JGBs than in absolute terms. The NIH3 position should probably be larger than it is (esp if I get taken out of some of the UK equity positions listed above). With Nikkei vol so high, selling puts or doing covered calls is the way to go.
The Sumitomo position is about 1/5 of what it should be, as the megabanks are such a leveraged trade on reflation. The basket of shipping lines is more of a special situation, which I’m not going into here as it will take too long.

            JPY rates
            Nothing. Ideally I’d still have the IRS steepener 5y 3y forward against 5y 20y forward (positive roll on both legs, and structurally short the back end, which is where the slow-motion JGB meltdown is already running). Not accessible via futures only though, so this is off the menu.

            As an aside, a short in long dated JGBs would be close to being my favourite structural trade right now. The BoJ seems nowhere near to buying the long end, and the bear market has already started. Higher USDJPY, inflation pressure and the risk of reflation running out of control, and the calamitous state of public finances are some of the key factors in favour of this trade.

            JPY currency
            GBPJPY            long 0.75m

            GBP is still suffering from the overhang of safe haven flows, or so it seems. The trade is to switch into an equal basket of USD and NOK (can’t bring myself to buy EUR). Besides, NOK is probably the first central bank in the world to actually start raising rates, so NOKJPY is a great cross to own from that perspective (and others). The short side in JPY speaks for itself. There’ll be no let-up in the pressure while Shirakawa is still running the BoJ, as people will hang their hopes (maybe correctly) for further jpy weakness on getting an ultra-dovish successor. 

USD

Equities
            ESH3                              long 100
            ESH3 Feb 1470c            short 50
            ESH3 Feb 1475c            short 50

This is just a synthetic short in the Feb 1470 puts and 1475 puts with 2 weeks left to run (I took off the 1475 puts on Wed as I had too much tail risk ahead of payrolls, but reset it again this afternoon right after the number for a net cost of 2 points : cheap). These puts have halved after payrolls, now that the event risk of payrolls is gone and since the market has rallied too.

            ESM3 Mar28 1440 call            Long 100
            ESM3 Mar28 1470 call            Short 100

Bought this call spread today for 6.5 points (30 points wide, so about 5:1). This is really cheap upside exposure : the market still seems underweight in stocks (there was almost no noticeable month end re-weighting trade : you’d have expected an equity selloff and fixed income rally after the moves in Jan. Instead we got nothing, suggesting people are using the mkt move to get closer to benchmark). That said, 1570 is clearly a barrier for the rally, so selling the upside beyond there looks obvious.  Hence the call spread.

Tactically I think the trade is to get another few days of time decay on the short position in Feb 1470 and 1475 puts before covering them, and then to sell the Mar28 1460 puts, which are around 15 points. I get paid 15 points for the 1460 puts, against paying 6.5  points for the 1540/1570 call spreads – ie both 40 points out of the money. So I can buy 100 call spreads against just 50 puts for zero cost. And the expiry ties in nicely to quarter end and Japanese year end – perfect for a window dressing rally… On top of that 1460 looks like a level where you ought to buy the market outright anyway, so being exercised on those puts is something I’d be comfortable with (given a Fed on perma-hold after today’s uptick in unemployment). In fact I can’t think of a better backdrop for stocks :
-       stable, if low, nominal GDP growth, so steady revenue growth
-       no cost pressure from wages or energy
-       a market that still seems underweight (no pullbacks to cover the underweight inherited from the fiscal cliff negotiations)
-       Fed on perma-boost at $85bn a month of QE
-       AAPL already deflated, so that risk is neutralised
-       Fiscal cliff deferred, if not properly solved

USD rates
            EDZ4                                    - long 75
            EDZ7                                    - short 125
            3em6 98.125p            - long 350

The EDZ4/EDZ7 steepener is insurance for the Fed changing their mind. If they’re wrong, and the labour market recovers sooner than they expect, then EDZ7 is mispriced by at least 100bps. And that’s before anyone’s unwound a single carry trade. At the same time, EDZ4 is near the top of its range, so I’ve sold out 40% of the long position and working orders to sell the remaining 60% in equal clips at 99.41/99.47/99.49. Look to buy back the 40% I’m underweight in EDZ4 at 99.28/99.21.

The blue Jun 81 puts are interesting. I have 350 of these at an average of 6.5bps. They ought to expire worthless, but the risk/return there is amazing. Time decay won’t be an issue for a month or two yet so nourgent issues there. The chart looks like it’s breaking down to 98.35 – but this contract traded 97.40 in Mar12. There’s a thought.