Monday 30 December 2013

year-end opportunities in eurusd and Japan

Right now I'm quite short fixed income in the US and Japan - what you'd have called a risk-on position a year ago - and so selling eurusd looks like a good offsetting trade. We're just reaching a nice 5 year trend line, so it's possible to set quite a tight stop on the upside :


The situation in Turkey is a potential catalyst for a selloff in eurusd (you can imagine contagion into the Euro if things get out of control). There seems to be some end-of-year selling of dollars at the moment, and from a medium term perspective the economic strength is definitely clearer in the US than in the eurozone, so this looks like a good entry point for several reasons. Anyway, I'm selling it around here with a stop not too far above that trend line. We'll see if it holds. 

In Japan I'm switching from short yen to long Nikkei / short JGBs. I've just taken profit on some usdjpy as the trade now looks crowded and possibly overbought in the short term. I prefer owning high dividend Nikkei stocks. The trading companies are absurdly cheap (Marubeni, Mitsui and Sumitomo have forward p/es around 6.5 and dividend yields of 3.5%) and the megabanks aren't much more expensive. I'm reminded of the situation in the UK 3 years ago : retail investors bought boring, high dividend, low p/e stocks in their ISAs (tax free wrapper accounts) when they realised rates wouldn't rise for years and high inflation would penalise cash deposits. NISAs are the Japanese equivalent and have just started trading. If I was a Japanese pensioner sitting on a lot of cash and worried by rising inflation I'd want the safest, most boring high income stocks I could think of, preferably names I'd known for years, all held in a tax free account. Buying the trading companies in a NISA fits the bill perfectly. They've been outperforming the index recently, as you'd expect as the NISA deadline approaches. 

JGBs have no obvious reason to sell off since the BoJ keeps buying, but the chart looks terrible. The banks have been buying put options, which says a lot (the "stupid gaijin" trade), and everyone is talking about the BoJ increasing their purchases sometime next year, so that risk is partly in the price already. It certainly isn't yet a widely held position, and I think we could trade another 10-15bps higher quite easily. 

Wednesday 18 December 2013

Fed to market : If you think we screwed up last time, just watch this...

It's interesting to compare the situation now with 2003/2004. If the drop in unemployment persists as it has for the last 3 years, we'll reach 6.3%, the level of peak unemployment in the dot com recession, around the end of next year :


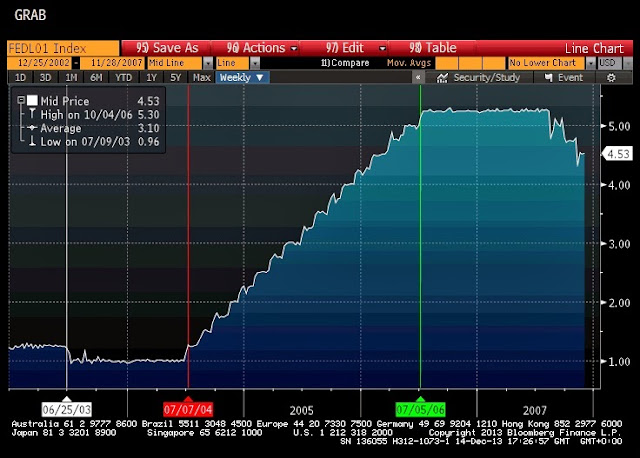
How should eurodollars be priced if the Fed subsequently reacts exactly as it did last time ? Well, they made their final cut to 1% in Jun03 as unemployment peaked, kept rates on hold for a year and then hiked in a straight line by 425bps over the following 2 years. Like this :


Matching the two dates of identical 6.3% unemployment suggests rates stay at 0.25% till Jan16, then rise to 4.5% by Jan18. Allowing 30bp for the funds/Libor spread, that gives 95.20 (4.8%) for Dec17 euros. EDZ7 currently trades at 96.80, ie 160bps too high (interestingly that's exactly where I'd expect the next selloff in EDZ7 to stop from a technical perspective : down 200bps from 98.10 to 96.15 over last summer, a 100bp bounce to 97.15 this autumn and then another 200bps getting you to 95.20-ish. Funny coincidence.).

Of course, there are some differences :
- Fed Funds are 75bp lower now than in 2003 : easier policy now
- the Fed is saying they'll keep rates low for longer than Jan 2016 : easier policy
- the Fed has ~$4trn of bonds on its balance sheet : easier policy
- the stock market is at an all time high instead of recovering from a crash : easier financial conditions
- GT10 is 3% instead of 5% : easier financial conditions

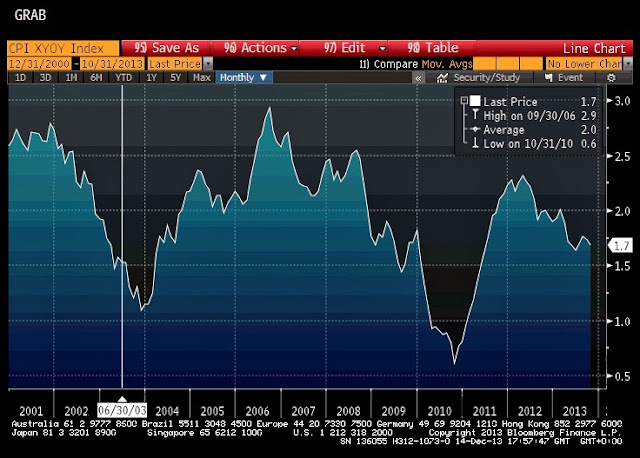
One thing that isn't very different is inflation. Here's core cpi :


Inflation is actually higher today than in 2003, so real rates are even easier than nominal rates. In fact current 10yr break-evens are almost identical now to their levels in 2003 as well.

Obviously the Fed made a colossal mistake in 2003-2007. They kept rates too low for too long and inflated a monumental bubble which nearly destroyed everyone when it burst. So how can the current forward guidance, committing them to even lower real rates for even longer, be credible ? It all comes down to inflation I think. If the core cpi numbers turn as they did in late 2003, then the Fed will start hiking rates soon. Within a few weeks everyone will be dusting off charts like these and drawing the obvious conclusion that the steady-as-she-goes sequence of rate hikes from 2004-2006 is a better-than-best case scenario, and that to prevent the risk of bubbles they really ought to tighten even faster. Which all points to EDZ7 and its friends being 200bps or more lower than they are now. 95.20 on EDZ7 strikes me as a best-case scenario.

Personally I think there's a significant chance of this realisation dawning on the market in Q1, as we post stellar growth numbers and everyone races to upgrade their forecasts against the backdrop of tapering. Low delta puts on the golds are the obvious risk/return trade. Ideally equities will fail again here at 1810 on spx, giving a risk-off trade with a great risk/return to set against the rates trade. The combination could be the trade of the year if it lines up.


Monday 9 December 2013

Nov update


indexed NAV
adjusted return
100.00
Nov-12 17.8% 117.77
Dec-12 37.4% 161.78
Jan-13 38.1% 223.40
Feb-13 -3.3% 215.92
Mar-13 12.4% 242.62
Apr-13 30.2% 315.81
May-13 68.8% 533.08
Jun-13 36.9% 729.55
Jul-13 -12.6% 637.46
Aug-13 -1.7% 626.31
Sep-13 -9.6% 566.31
Oct-13 -4.9% 538.62
Nov-13 11.5% 600.41

Having drawn down from Jul to Oct (my own fault in Jul and Oct, and also due to the Fed's disgraceful behaviour in Sept) I was uncomfortably close to my stop by the end of Oct. I'm running a 30% drawdown from peak month end NAV, so I was 3.8% away at the end of Oct and running correspondingly smaller positions than in Jun. After Nov I'm back in the clear, so I can trade more freely without being constrained by the proximity of the stop. The easiest market has been fx, as the market looked into Q1 and saw a tighter Fed and a BoJ which is likely to undertake another round of easing :

Equities            2.7%        Nikkei longs (aka USDJPY) worked, offset by a small loss from long VIX
Commodities   0.4%        Short gold again, having been stopped on the same trade in Oct
Fxd income      0.0%        Gains in Aussie bills and short TYZ3 offset by losses from short JGBs
FX                    8.4%        Long USDJPY, GBPCHF and short AUDUSD and AUDNZD all worked

I should have made more in equities really : after payrolls it was clear that the hedge fund community needed to reduce the performance gap with equities to avoid some difficult investor conversations. The problem is that the taper is coming though. Never mind the data - the guard is changing at the Fed and QE is Bernanke's pet, not Yellen's. She's more interested in optimal control and convincing the market that rates will stay low for another 3 or 4 years. Anyway, QE's days seem numbered, and even if you believe that this year's equity rally - powered by  multiple expansion - has nothing to do with QE (I don't) then you don't want to find out the hard way that you might be wrong. After a great year, and with a major change in the monetary landscape coming, common sense suggests reducing equity positions. So being long stocks feels to me like picking up the last few pennies in front of the steamroller : 2% of upside vs 10% of downside. Not very attractive, so I left the equity market in the US alone in Nov.

Current thoughts (in brief):
I'm now short equities, but concerned I'm too early. Vol has picked up, and the 1810 highs should be met with selling from some over-excited longs from a couple of weeks ago. Maybe that will cap the upside now. If not, I'll respect the rally and cut.

FX still seems the easiest market in my opinion. I'm short AUD, JPY and CHF against GBP, USD and NZD (small for the latter). My risk-off hedge is long Aussie Dec14 bill futures, as before. More and more people are starting to suggest a final cut in 2014, but even without this the position still works. What's clear is that the hurdle for  rate hikes is higher than people thought a few months ago. I think rates aren't rising for a couple of years at least and AUDUSD probably heads towards its 0.82 low from 2010.

Fixed income. I like being short JGBs, for the first time in ages : real yields are negative in Japan and positive in the US, and the gap is the widest since 1998. That's triggered the second largest flows into Treasuries from Japan since they started collecting the data in 2000 - in other words, Japanese institutions are voting on JGBs with their feet. Everyone believes Abenomics will stutter in the spring and require more bond buying from the BoJ, so it only takes a few signs of durable success to make them question that assumption. That would push JGB yields a lot higher (ok, 15-20bps higher anyway). The negative carry isn't so bad, and positioning seems quite clean. Everyone's afraid to fight the BoJ, but there's always a level where it's the right idea.
Elsewhere I'm running a medium sized short in TYH4, as yields seem set to drift just north of 3% with a Jan taper. To an extent it's the same as the JGB trade though.